Microclimates, the impact of the built environment and mapping Dublin’s trees with Prof Gerald Mills.
Prof Gerald Mills
UCD School of Geography
UCD Profile
Q. You did your undergraduate in Geography and History and later focussed on Physical Geography? Tell us a bit about your academic background.
A. Well you have to go back a bit! It was 1977 when I came to UCD and there were a lot fewer options. I knew I liked Geography and History so I started with those subjects, as well as Politics. Politics was interesting but John Locke wasn’t interesting to me at all, so I was left with Geography and History. There really wasn’t a lot of opportunities, but there was a teacher in climatology (Stuart Daultrey) who said you might be interested in pursuing some work in climatology because your essays are quite good. That’s all you had at the time, there was no continual assessment. You had to do an undergraduate dissertation and I did mine on social geography, on cities and road accidents.
After that I left for a year to work, then I came back to do a master’s focussed on climatology which I did on rainfall. Climatology is a very small part of Geography in Ireland. Climatology has not been a very strong part of physical geography until very recently in Ireland. It’s largely been dominated by geomorphology, there hasn’t even been much biogeography until recently. That’s largely because of the British influence on the subject, I think. When I was away for thirteen years and there was only one job ever that asked for a physical geographer who was a climatologist during that time.
After my master’s I worked on a project for one year about computer mapping. That was my first engagement with what was to become Geographic Information Systems (GIS). Then by pure chance – so much of life is luck – there was an individual here who did his degree in Ireland, Morton O’Kelly who was a Professor of Geography at Ohio State University (OSU). He met my advisor and suggested if I was interested, I should apply to go to Ohio State. I went over there with the intention of working with someone on what was referred to as synoptic climatology, which was closer to what I did as a graduate student.P
Q. What’s synoptic climatology?
A. Synoptic climatology is the idea that you can classify sequences of circulation systems that could be linked to weather. By contrast, forecasting the weather was based on the understanding the physics of the atmosphere so that its state (in terms of pressure, temperature, etc.) could be predicted in the near future. I went to OSU to work with a synoptic climatologist (someone who worked on atmospheric ‘teleconnections’ such as the El Nino Southern Oscillation (ENSO) effect in the Pacific ocean). I quickly discovered however, that I was far more interested in learning how to do computer modelling. I ended up working with John Arnfield on the climates of cities. It’s hard to go back in time like this, but it turns out Ohio State was extremely good for me because it was focussed on physical, rather than descriptive, climatology. This meant that it employed simple conservation laws to the study of climates near the ground and emphasised measurements (including making instruments) and numerical modelling.
Q. Why study climatology through Geography as opposed to other subjects like for instance meteorology?
A. At this time, meteorology was very much focussed on forecasting and, in the US, didn’t do any of that stuff. It was very much focussed on forecasting until very recently. It didn’t do any climate change either, which was at the time a part of Climatology which was a small part of Atmospheric Sciences, including Physical Geography.
Geography was always concerned with the relationship between humans and their environment. Therefore, it was a very good fit for climatology to be inside Geography, because Geography was very much interested in how humans modified their environments. People knew that Carbon Dioxide could change the atmosphere but until the 1970s it was generally accepted that the only clearly identifiable effect of humans on climate was in cities, which were warmer than surrounding areas (the urban heat island). There were some individuals that worked in other fields but substantially that field of climate as understood as being close to the ground was dominated by physical climatologists. That changed during the 1980’s.
“Globally, most of the CO2 is coming out of cities and cities are at greatest risk – practically all the large cities are located at sea level, on river systems, on basins. If you were to start out and pick all the places in the world that are likely to be flooded, that are likely to have earthquakes, be next to volcanoes, that’s where all of our cities are.“
Q. In what sense?
A. For meteorologists the forecasting problem became solved in many respects then what you saw was the models getting more and more precise and other issues started to dominate. The development of meso-scale models (originally for phenomena such as hurricanes) meant that smaller scale features (such as cities) could be included in atmospheric models. Those models were now used to examine regional scale air pollution and pollution associated with urban effects on the climate. Even then these models worked at quite a large scale, with grids on the order of 10 square km as an individual cell. The work I was doing was inside individual streets at a micro-scale (<100m). At this stage in the development of an urban climate science, the approaches were at different scales and it would take a couple of decades before the links could be made.
So much of the work done at the micro-scale area is associated with the climate as experienced by humans. You’re looking at dimensions of 2m tall. Everything is within that framework, so it Is literally what’s next to the ground and impacts on humans. It also then must account for decision-making at this scale that creates the microclimates. As the urban climate field developed, it has become a great deal richer and the subject is now part of urban planning & design (green infrastructure), building and landscape architecture (sustainability), air quality meteorologists, and of course, still climatologists.
This change has partly come about as urban issues have come to dominate the debate around climate change. Globally, most of the CO2 is coming out of cities and cities are at greatest risk – practically all the large cities are located at sea level, on river systems, on basins. If you were to start out and pick all the places in the world that are likely to be flooded, that are likely to have earthquakes, be next to volcanoes, that’s where all of our cities are. That’s because that’s where the rich land is, on river basins. So, global management of climate change and of risk requires an urban focus.
“If you took a city block with buildings on it, then each side of that block will be facing different directions, so you’ll have summer on one side and perhaps autumn on the other.”
Q. Can you explain the concept of microclimates within the context of the urban environment?
A. It’s about scale. The typical mid-latitude cyclone that affects Ireland is described as synoptic scale and its movements are recorded by conventional weather stations supplemented by satellite imagery. Smaller scale systems, such as hurricanes are meso-scale (<2000 km), and are too small to be captured by this type of station network. Micro-scale systems are smaller still (<1km) and may include individual thunderstorms and are a result of processes at that scale. Urbanised landscapes are extensive (meso-scale) but create a great variety of microclimates due to building dimensions and layout, different materials and land uses. This makes them difficult to examine as the microclimate at each place is distinguished by the immediate surroundings; the challenge is to find representative micro-climate environments for study (such as streets) that can be generalised.
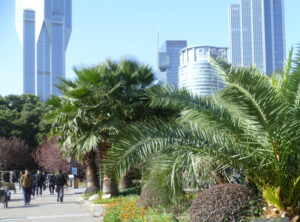
The thing about cities, which is something we’ve built, is that we can create all kinds of climates over short distances. If you took a city block with buildings on it, then each side of that block will be facing different directions, so you’ll have summer on one side and perhaps autumn on the other. If the atmosphere is stationary, you’ll see big changes from street to street based upon the amount of energy it’s getting from the sun, the different types of fabric, the heights of the buildings, the different materials. You will experience dramatic surface temperature changes over very short distances; on a hot day asphalt could easily be 50°C , where the temperature of concrete next to it could be 20 degrees lower. All these different surface temperatures will affect the overlying air and pedestrians. If the air is calm then the overlying air takes on the characteristics of the surface it sits over and you get considerable diversity in air temperature. However, if the atmosphere is windy the thermal microclimates tend to be diminished and, it is rains, then the differences between surfaces are obliterated. If you get rain and wind, then microclimatic variation is mainly about shelter and exposure; simply turning a corner can mean a dramatic change in the wind you experience.
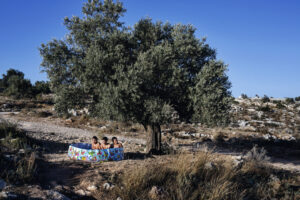
So those are microclimates. You’ll see them regularly used in agriculture, whenever you plough a field, when you plough a field east-west the furrows themselves create their own topographies. The seeds will grow on one side of the furrow but not another because they have access to more sunshine. It also means at night-time you’ll hardly ever find frost in the groove. You’ll find it at the tip of the furrow but not in the groove. Because inside the groove the sides are basically sharing radiation with each other.
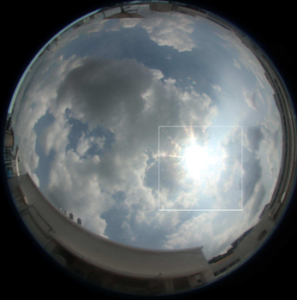
Image: Met Éireann.
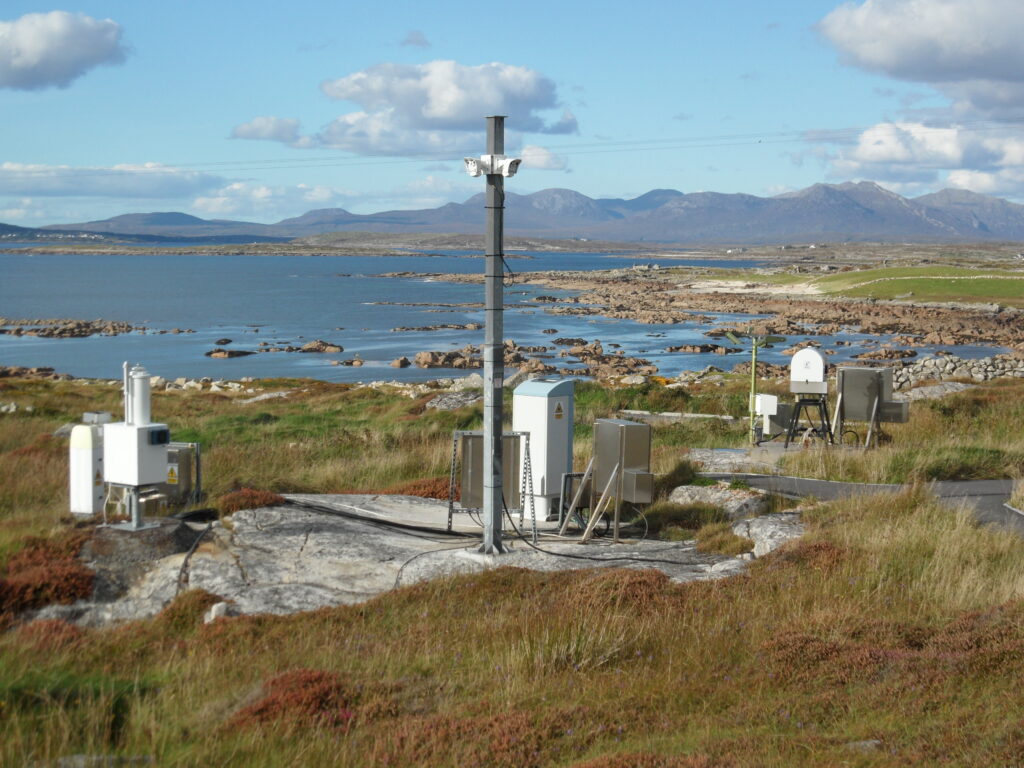
Q. Are these kinds of variations picked up by weather stations?
A. Microclimates are essentially what you try to avoid when you’re putting up weather stations. With weather stations, they try to choose the same environments. They’re supposed to be all located over short grass, with no obstacles around them, so they can access the airflow. If all stations are in those environments, you’re not looking at ploughed ground versus asphalt, you’re looking at the regional climate played out based on location. You’ve eliminated the differences between the surfaces. The reason why you rarely find weather stations within cities is because they’re regarded as contaminated.
This has all sorts of consequences; it means you never measure weather where people live. It’s weather where people do not live. For instance, if you want to know about Dublin, your natural port of call would be Dublin airport, but this environment is quite different to the rest of the city. It’s the driest and sunniest part of the city and experiences the effects of the nearby sea. So if you were to base your assessment of climate in Tallaght (which is at the base of the Dublin-Wicklow mountains), for example, based on information from the airport, there would be significant differences.
“Whereas air quality was always regarded as the major environmental health issue in cities, heatwaves which are enhanced by urban effects have become an important driver for urban design changes”.
Q. In what sense are you interested in the role of the built environment, urban design, urban planning in improving and impacting on urban microclimates and creating more resilient cities?
A. Well, it’s completely changed. I’ve been here since 1997 and until very recently, there has been very little interest in research on the urban environment. Most of my work is with colleagues internationally on the climates of cities. Recent events, such as the concern for resilience, for carbon neutrality, 15-minute cities, etc. have shifted the attention here to urban areas. I think that lack of attention in Ireland has mostly been because of the need to establish a climate science in Ireland generally and the focus on agriculture as a both a source of greenhouse gas emissions and an important economic sector. The work that I do is mostly with colleagues that I have in America and Europe, largely in the framework of urban climate science and tools for urban adaptation to enhance resilience and ameliorate urban climates. As cities are human creations, they can be modified by changing land-cover and land use to offset undesirable climate outcomes.
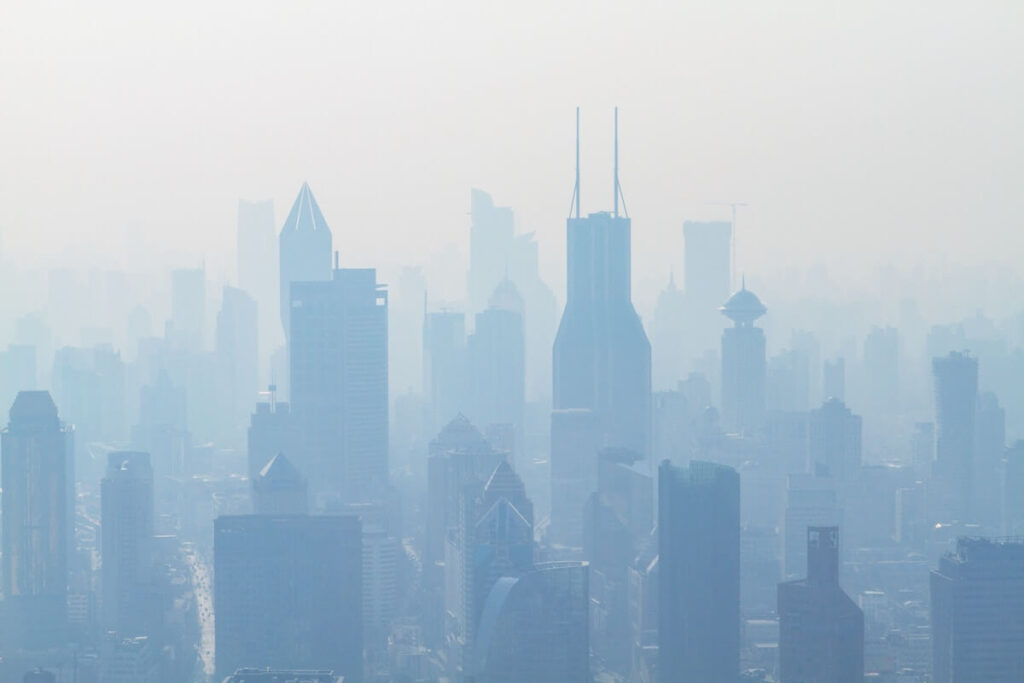
A lot of this, as with so much environmental issues, is almost always driven by crisis. Whereas air quality was always regarded as the major environmental health issue in cities, heatwaves which are enhanced by urban effects have become an important driver for urban design changes. For example, the 2003 heatwave resulted in more than 15,000 ‘excess’ deaths in France, most of whom were living in cities, and elderly. This sort of transformed people’s views about what risk was and what the implications of poor urban design could be for climate change, which projects more frequent and stronger heatwave events. I see my work as contributing to an urban climate science that is integrated with the global climate science so that the impacts of cities on climate and vice versa can be understood and managed.
Global climate models do not currently include cities directly, which comprise about 3% of the Earth’s land area. This means that the projections of climate change have to be ‘downscaled’ to cities. However, these models are getting more precise and have enhanced demands for information; it is expected that the next generation of these models will include cities. As part of my interests in an urban climate science, I have been working on with colleagues for the last ten years on creating a database of cities globally that provides the information these models will need. Currently, we have no details for most cities on the planet, so even if the models could integrate urban areas, they have no data to do so. The World Urban Database and Access Portal Tools (WUDAPT) project has mapped all the cities in the world using a landscape classification that is linked to numerical descriptions of urban land cover that can be fed into atmospheric. WUDAPT is putting together the data infrastructure in preparation for the next iteration of models.
Q. What kinds of data are you collecting?
A. Things like heights of building, spacing between buildings, proportion of landscape that’s vegetated, proportion that’s impervious, the proportion that’s built up, the heat capacity of the materials, the anthropogenic heat flux, and so on. These models are not exceptionally demanding, it’s just that the data has never been gathered. It’s only just happened in the last few years that because of satellites they can put together global data. One of the global databases that I’ve been putting together with colleagues is essentially a map of what we refer to as local climate zones.
We are using ten categories of urban whereas all the models up to recently have been using one category of urban, it just says it’s urban. That means the city centre is the same as a suburb in Dublin. It means that Hong Kong is the same as Dublin. They’re clearly very different types of landscapes. Not having a universal system of classification of these types of landscapes has made it very difficult to communicate. You need a language, a classification system that is appropriate for the subject. I need to say that Manhattan is more like Hong Kong and less like London. The data is put together using Google Earth, using these massive satellite datasets and expert classifications.
Q. What approach do you take on the ground in cities in terms of understanding its microclimates?
A. If we want to understand how the climate of cities comes to be then the best way to do it is to break down a very complicated problem into smaller elements that can be understood. A classic way was to look at urban canyons, ignore everything else and just say this city is make up of all these different streets, the streets are different sizes, but the fundamental thing is that it’s a street. Then you study that street, and then you look at individual buildings. You basically isolate each element and then you try to understand it completely the problem is how to put it all back together again so that the parts are connected. I think the problem in one sense has been trying to put it back together again so we can tell what the climate is like in a place, rather than just one aspect of climate. Originally there were very few people working in this area, that’s changing now. There’s an awful lot of urban planners and designers and engineers now working on this. if you type in ‘urban heat island’ in the Google Scholar search, you will get hundreds of papers most of which were published since 2010; keep in mind that this phenomenon was first reported on in 1818!
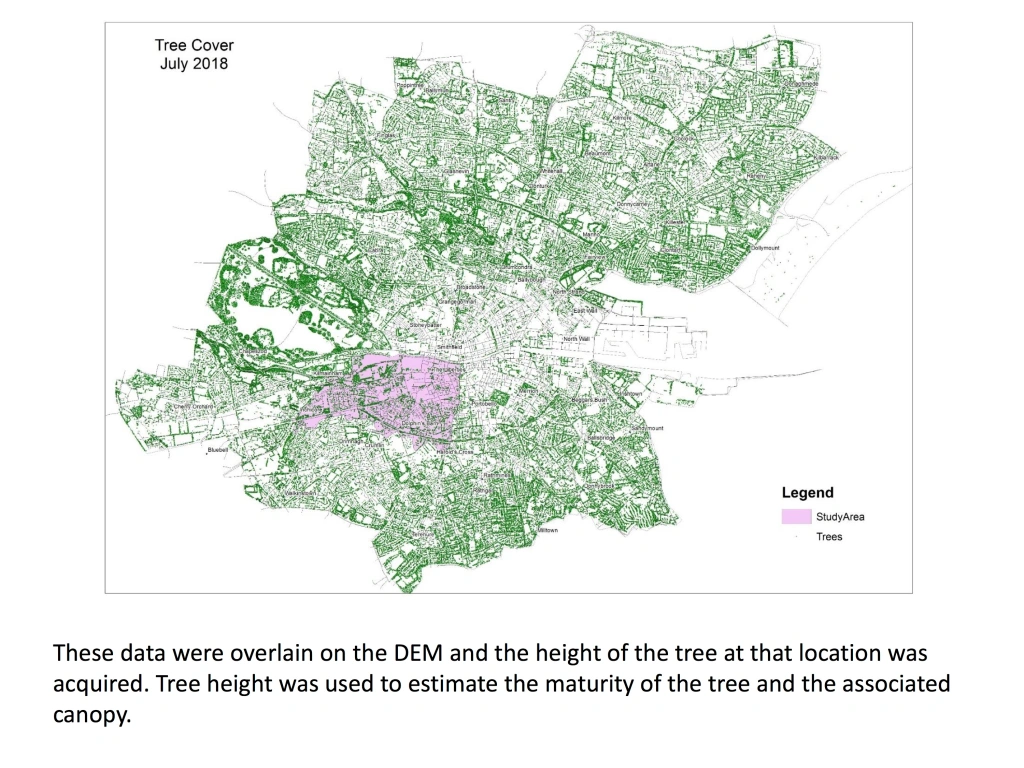
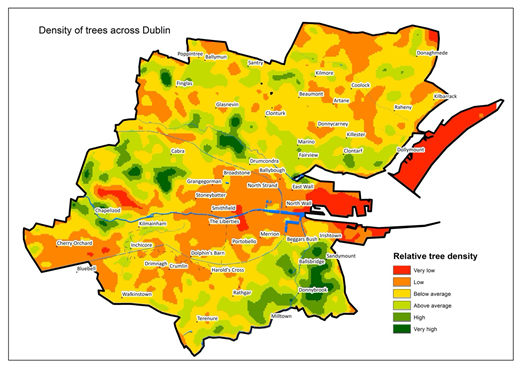
Dublin tree cover (image: Mapping Green Dublin)
Q. Tell us about your work on trees and green spaces in Dublin and some of the benefits they bring
A. Besides buildings, you can’t really understand the climate in the city without considering both buildings and trees, which disturb atmospheric flow and generate shadows. I worked with a colleague of mine here in UCD, Tine Ningal, years ago trying to put together a database of trees in the city centre This grew and we added more information when and where we could, often as part of student projects. Eventually we had the opportunity with the EPA-funded project Mapping Green Dublin which we decided to use it as an opportunity to map out all the trees in Dublin city. We identified where the trees were located and we used a digital elevation model to work out how big the trees were, that would give you a sense of the size of the tree and the age of the tree.
Q. Are the trees and green spaces quite unevenly distributed by neighbourhood?
A. Yes, they are unevenly distributed, sometimes for quite practical reasons. Often parts of the city which have been occupied for a long time and are quite densely occupied, there’s not a great deal of green space. There are also lots of spaces in the city that are green that haven’t necessarily got many trees. If you go out to places like Crumlin you’ll find there’s lots of green but not many trees necessarily plant trees. in other parts of the city (for example where UCD is) you’ll see many trees that are also very mature with very large canopies. The spatial distribution of trees across the city has many explanations. Clearly if I can’t afford to buy a big piece of land, so I just get a terraced house (or an apartment), I probably won’t have a tree. If I buy a big piece of property out in Sandymount, then the chances are I’ll have a big piece of land that quite possibly has a tree in it already. In other words, it’s not necessarily that the tree cover is the result of urban planning, it’s just the more money you have the more space you have and the better chance you have a mature tree.
The other question is about trees that are planted on streets, what you might regard as public trees, or trees in parks. There are certainly different rates of tree planting across the city. It wouldn’t necessarily correspond to wealth and poverty. What you’ll find is the landscapes people occupy are related to their wealth. You can use it as a marker. Generally speaking, when you’ve fewer trees you often have less general space that is free to use. You have less space available per person for a park. I don’t think Dublin is badly served overall by green space but there are parts that have few trees and green spaces. Also remember that much of the city’s green space is concentrated in one very large space (Phoenix park), and then the question is about access to that park, which is a different sort of issue.
“it is not possible to plant enough trees for the city to be carbon neutral, based on current emissions”
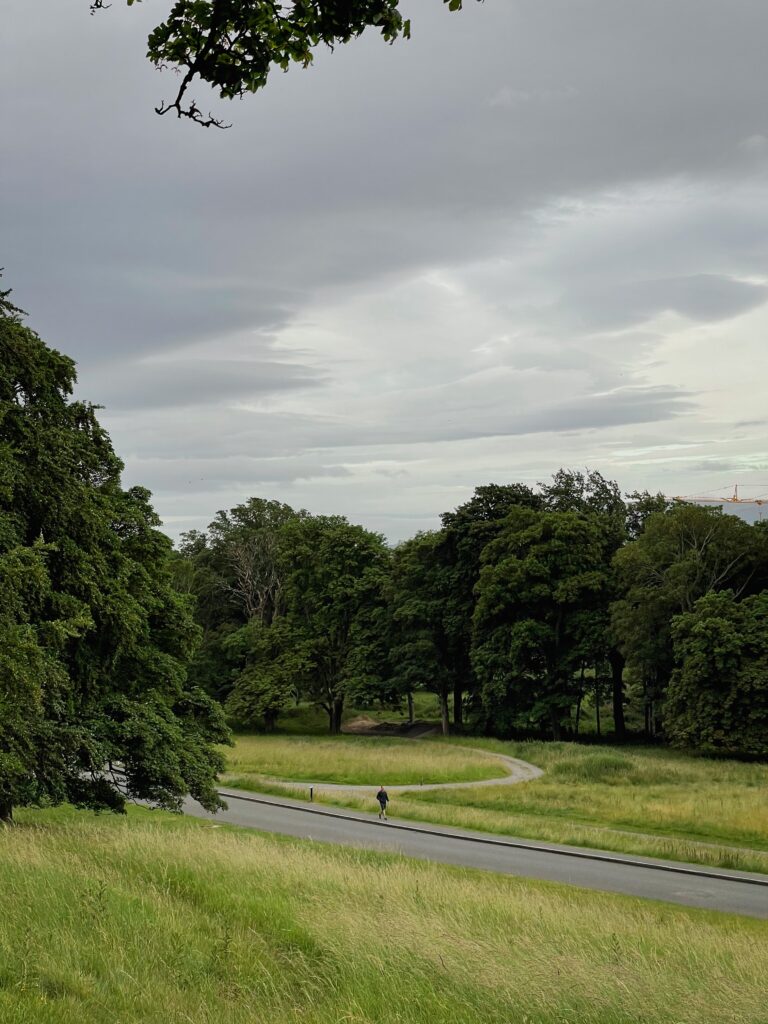
Phoenix Park, Dublin.
Q. In broad terms what do trees and green space offer to cities?
A. Well, they can offer certainly contribution to biodiversity if they’re planted properly, they can help with hydrology because they delay the arrival of rainfall from reaching the ground and potential pluvial flooding. They can also contribute to shelter because the slow the air and in traditional buildings shelter belts around houses provide a layer of insulation.
Besides the contributions to the natural environment, trees contribute to public health. I think we discovered during Covid that people appreciate trees. From a health point of view if the city was to plant street trees and properly landscaped parks, people feel the city is invested in their landscape and they feel better about their neighbourhoods. People have more pleasant walks to take, it also means that the air tends to be cleaner. One reason is because if you’ve more trees you’ve less space for cars. There’s no doubt about it that trees can scavenge some air pollution from cars and improve the air quality, but it is the combination of traffic reduction and tree planting that has greatest impact.
For example, it is not possible to plant enough trees for the city to be carbon neutral, based on current emissions. In this country, trees are probably best used for shelter, for hydrological control and for biodiversity and less so for shade, which would be a major contribution in hotter climates.
“The other issue that would concern me is the shift toward higher density neighbourhoods and the need for adequate planning of the outdoor spaces available to residents. As we shift from that individual personal dwelling with a private garden to apartment living greater consideration to the outdoor environment needs to be provided.”
Q. In relation to planning for urban resilience and readiness for climate change – how is Dublin doing?
A. It’s hard to make a comparison. I don’t think Ireland is going to get the worst of climate change. When you look at the landscapes that are going to be lost, it’s going to be the coastal zones that are going to be affected by sea level rise. Our challenges whether we want to protect those areas or not; the places that would concern me are where we’ve started investing in the port areas which is close to sea level and are at risk of flooding over the coming decades. The intensity of the investment on offices and apartments here is considerable and this landscape will need protection from projected sea level rise.
Beyond that, in terms of general infrastructure in the city, I don’t know if we can afford to retrofit all the houses that need to be retrofitted. Based on work that I did with a PhD student, 30% of the buildings in Dublin would have a BER ration of F or G and have been built before any building energy regulations. That’s not to say that 30% of the population live in those places, but you’re looking at very sizeable housing stock that cannot be retrofitted using conventional methods like cavity wall insulation. This includes Dublin’s Georgian buildings, which will require a great dela of money to radically improve their BER rating. I think that is will be a major challenge; either we have to generate energy which is carbon neutral so that its use does not drive climate change or, we invest considerably to retrofit or, we change the use of these buildings so that they do not require heating. I don’t where the balance will come. The other issue that would concern me is the shift toward higher density neighbourhoods and the need for adequate planning of the outdoor spaces available to residents. As we shift from that individual personal dwelling with a private garden to apartment living greater consideration to the outdoor environment needs to be provided.
Q. Tell us about the collaborations involved in the Mapping Green Dublin project, where you worked with artists and communities?
A. In that project, I collaborated in a sense that I did a piece of work, and I was prepared to communicate it to a non-specialist audience, using maps especially. I think that’s what people wanted out of me doing that job, as an independent scientist. The community were perfectly able to make the arguments, what they wanted was the information provided in a manner that they could use. If you think about how planning operates, it’s basically an unfair game because one side has all the information. If the other side wants to make an argument, they must acquire data to support their cause. By providing the community with information on their neighbourhood and placing it in a city context, that gave the community the power to make decisions about what they wanted.
My co-PI on the project, Niamh Moore-Cherry (urban governance) has a lot more experience working with communities to develop pans through co-operative and public engagements. The combination of a physical (me) and human (Niamh and Alma Clavin) skills with the community-based artists, Seodín O’Sullivan proved to be very effective. Some of Seodín’s work was based trees and growing as forms of art on the urban landscape. Seodín was based with Common Ground (local arts organisation) based in Inchicore and this provided a unique opportunity for us to acquire and organise work on green infrastructure and place it in a community planning context.
In addition, Covid might have been a disaster but it provided an opportunity for this project as residents in the community became much more aware of what was available to them as available greenspace in their neighbourhoods. We provided them with the basic information that they could argue for improvements to their space and that meant that they could compare to other neighbourhoods. It allowed questions to be posed about traffic, air quality, quality green spaces, places to walk and so on.
The Mapping Green Dublin project showed the advantages of bringing different skills and perspectives to bear on a topic (greening) in a place (Inchicore) – I don’t think it would have been possible to achieve its outcomes without the overlap of talents. When Seoidín was doing her work, trying to engage with people about how best to enhance greening in the area, my job was to provide the data in the forms of maps and graphs to support this work. We were lucky that Common Ground provided the community foundation, they had the connections within the community, and Niamh and Alma had all those skills in terms of dealing with communities around planning issues and co-creation methods. We also collaborated with Ronan Foley in Maynooth, who incorporated his interests in blue space, using the Camac river, into the project.
Q. What was the outcome of the project?
A. The outcome was that the Inchicore community created their own green plan. One consequence is that individuals made submissions to the Dublin development plan and in other areas community tree planting took place. The tree dataset we generated was free so anybody can use it, which means we gave an avenue for conversation with DCC and with other communities whole of Dublin City Council. So I guess it was just the right project at the right time.
“Sometimes you’ll find the earlier models forced you into considerations about what you were looking at because essentially computer resources were so parsimonious that you had to be a lot more clever about the project.”
Q. The final question is about GIS, methods and technologies – have you seen huge improvements in what these methods can do over your career?
A. Well, the GIS models get better and better because the computer resources get better and better, which means you get more and more data. It doesn’t change your ability to think. So sometimes you’ll find the earlier models forced you into considerations about what you were looking at because essentially computer resources were so parsimonious that you had to be a lot more clever about the project. Whereas you’ll find with a lot of stuff that’s readily available now, you get junk, because the pressure Is off you to constrain and ask specific question. The amount of information that’s available now is simply jaw-dropping but to process it, you still need to be clear on the ‘why’.
The improvement in models have been extraordinary too, but they are so comprehensive that you must be very structured in your thinking to get something out of it. I’m working on a project now on greenhouse gas (GHG) emissions using the Weather Research Forecasting (WRF) model. WRF is a community model that began as a hurricane model then went through all sorts of transitions and now is a meso-scale ‘generic’ model used to simulate weather, air quality etc. As part of a Microsoft-SFI funded project, Terrain AI, we are applying the model across Ireland at 1km resolution; once complete we will be ‘nesting’ a Dublin model within it that will use all of the tree, traffic and building data to generate GHG emissions and sequestration across the landscape. The opportunity to start to look at the physical environment in such a comprehensive manner is entirely new and exciting. The wider project includes measurements, observation platforms such as satellites and drones alongside the models. This type of research, which is internationally relevant is possible because of the funding and the teamwork that now exists in the Irish universities.
Essentially, I don’t know if the data and technology has made it easier. I think it’s more of a management problem. It’s harder and harder to carve out a unique name for yourself, to say here’s an area where there’s nobody working but it’s a lot more fun, because it is not isolating, and the scale of the work can make a difference in terms of enhancing knowledge and contributing to policy. It’s exciting times and I think it’s a good time for the Earth Institute because I think its time has come – the sort of multi-disciplined approach to meet the challenges associated with global environmental change is what is needed.